Access flow (1)
2007/04/13
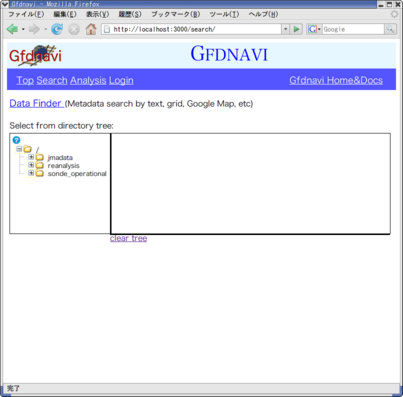
Open the top page -->
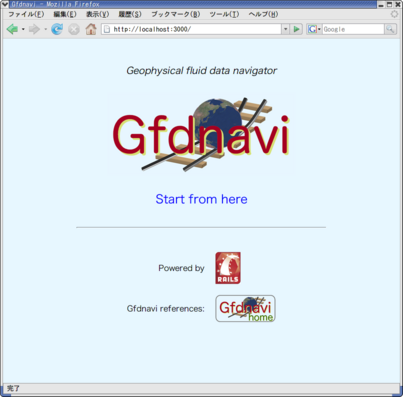
Click "Start from here", and you'll see a directory tree window -->
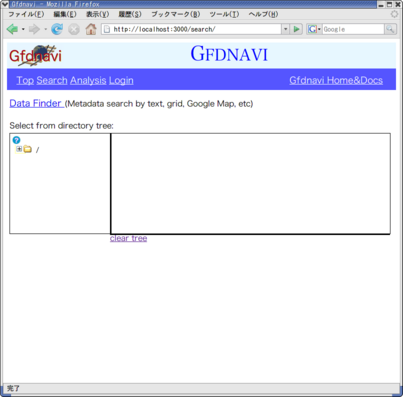
If you click the folder mark or [+] of a directory, it opens -->
Click the directory name. Its contents are shown
in the rhs window -->
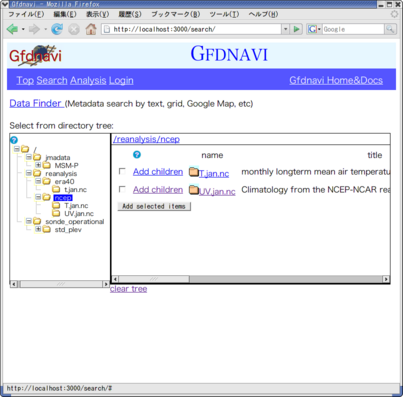
If you see "Add..." (and if you want to select the line), click
the check box,
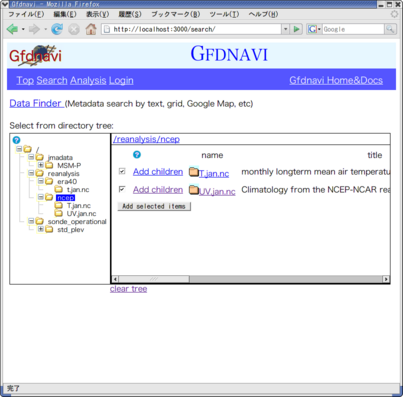
and if you click the "Add selected items",
you'll proceed to a visualization/analysis window -->
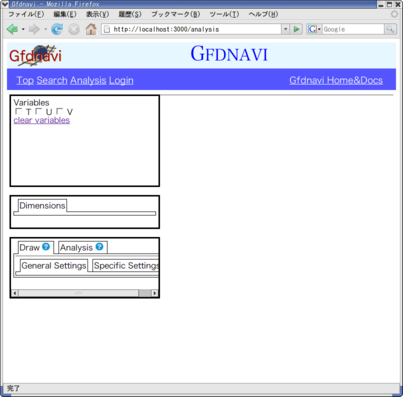
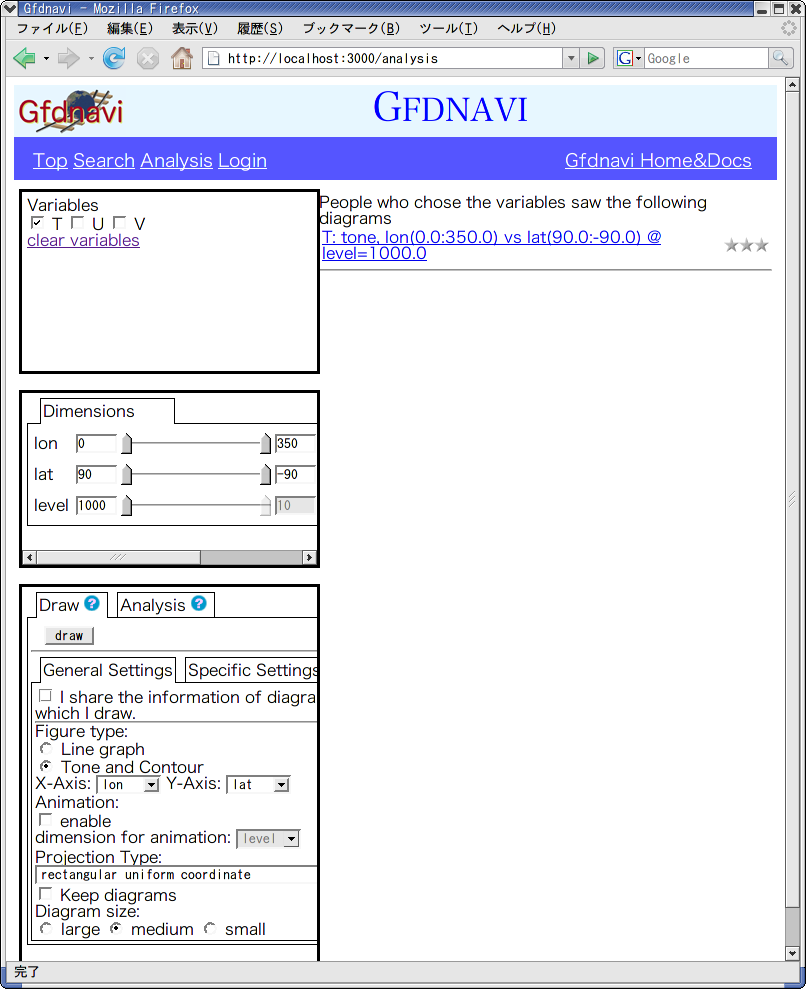
Select a variable (here, 'T') in the window on the upper-left.
Then, you'll see the dimension selection window (middle-left)
and the visualization/analysis dialog windows (lower-right) -->

Select dimensions and visualization options as you like -->
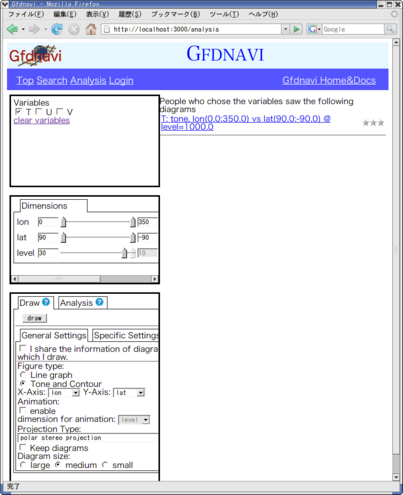
(Here, altitude ("level") was changed, and the polar stereo
map projection was selected.)
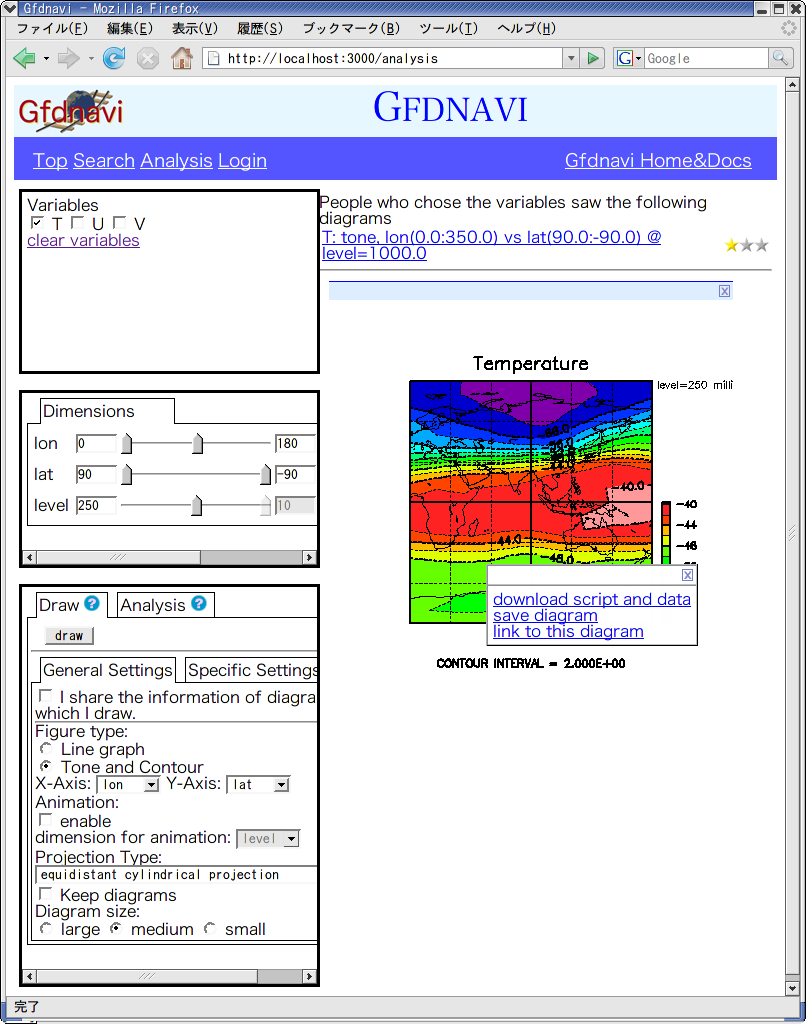
Press the "draw" button in the lower-left window. Then
you'll see an image created interactively -->
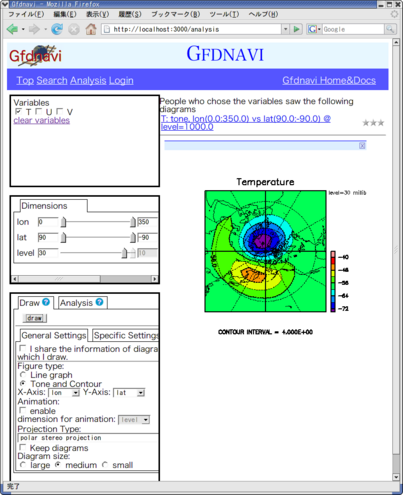
There are a variety of visualization options:
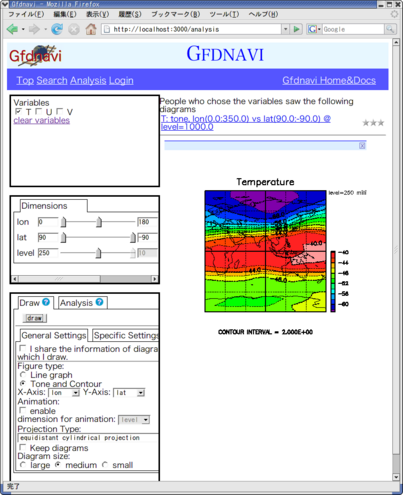
Also available are line plotting, vectors (arrows to view flows),
etc. You can also composite multiple graphics.
If you click the image, a popup menu window appears -->

Here, your choices are,
- to get a ruby script to reproduce the image and a
NetCDF file that contains the minimum amount
data to reproduce the image.
- to save the image (along with metadata, which you can enrich)
at the server (need login: see below).
- to obtain a html link to reproduce the image dynamically
on the server.
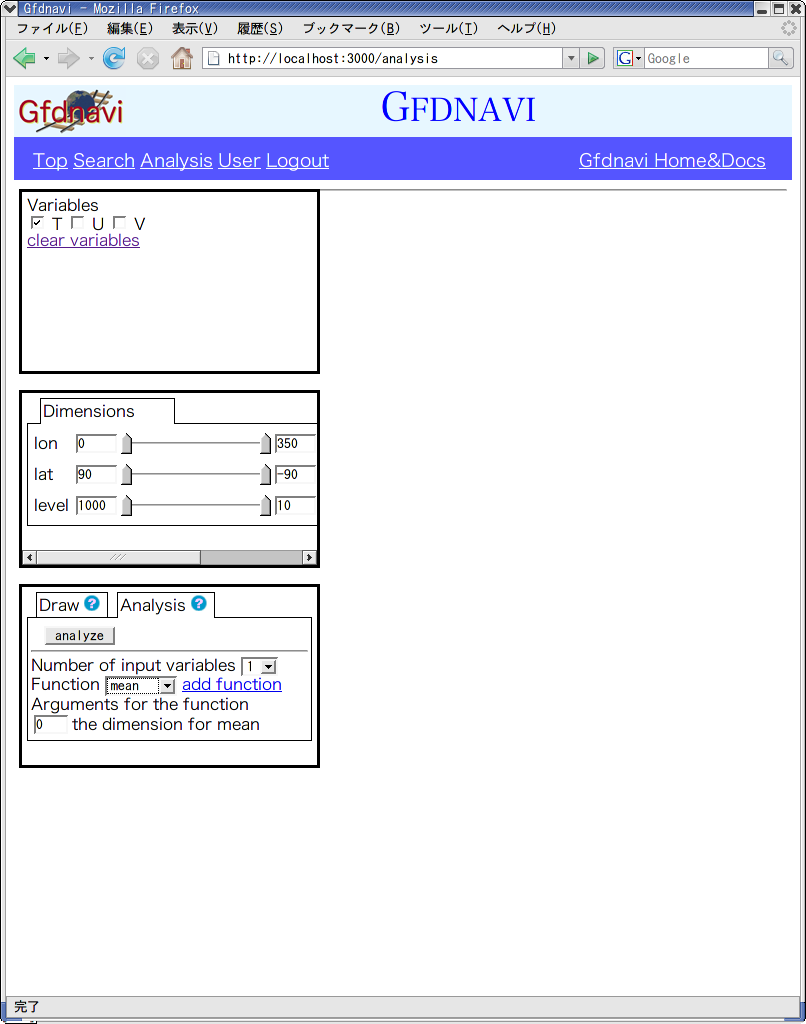
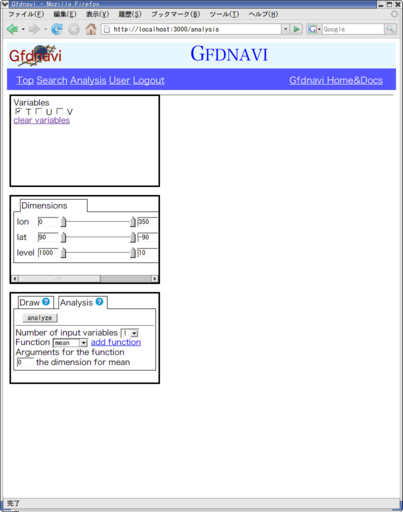
If you select the Analysis tab in the lower-left window,
you can do numerical analysis -->
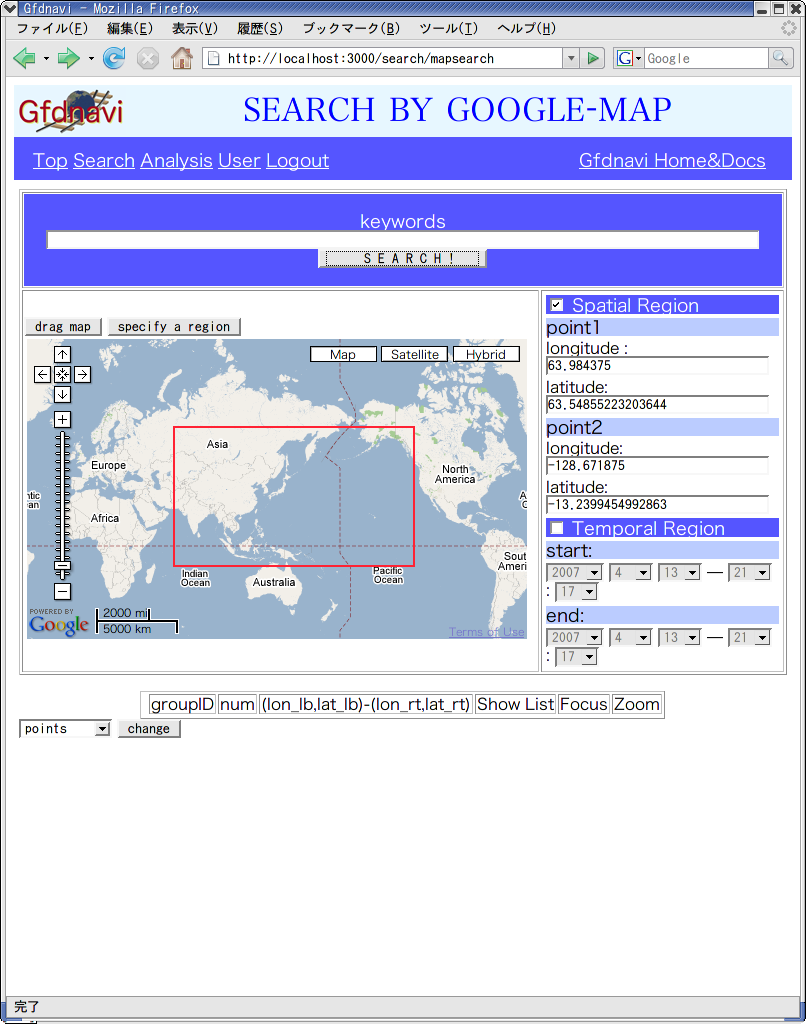
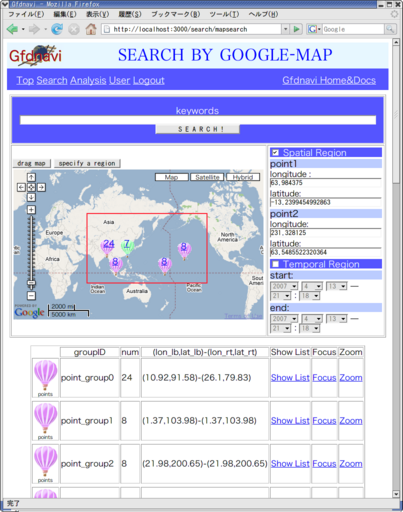
BTW, you can search data from the database.
To do so, press the "Data Finder" button in the
tree view (the "Search" link on
top) -->
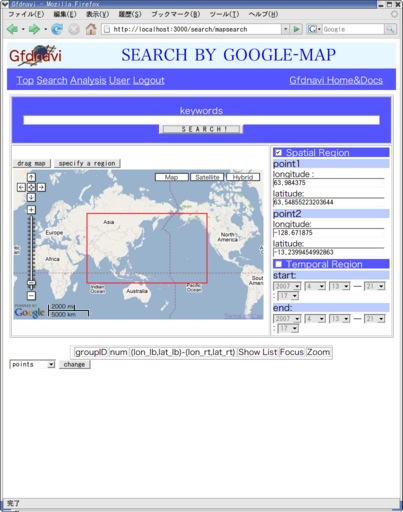
You can search data though text matching and space-time
information
(here you can use Google Map) -->
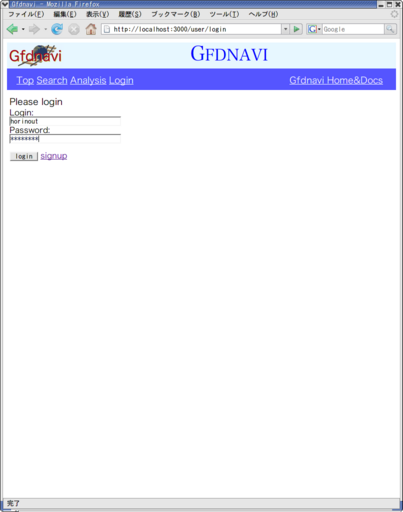
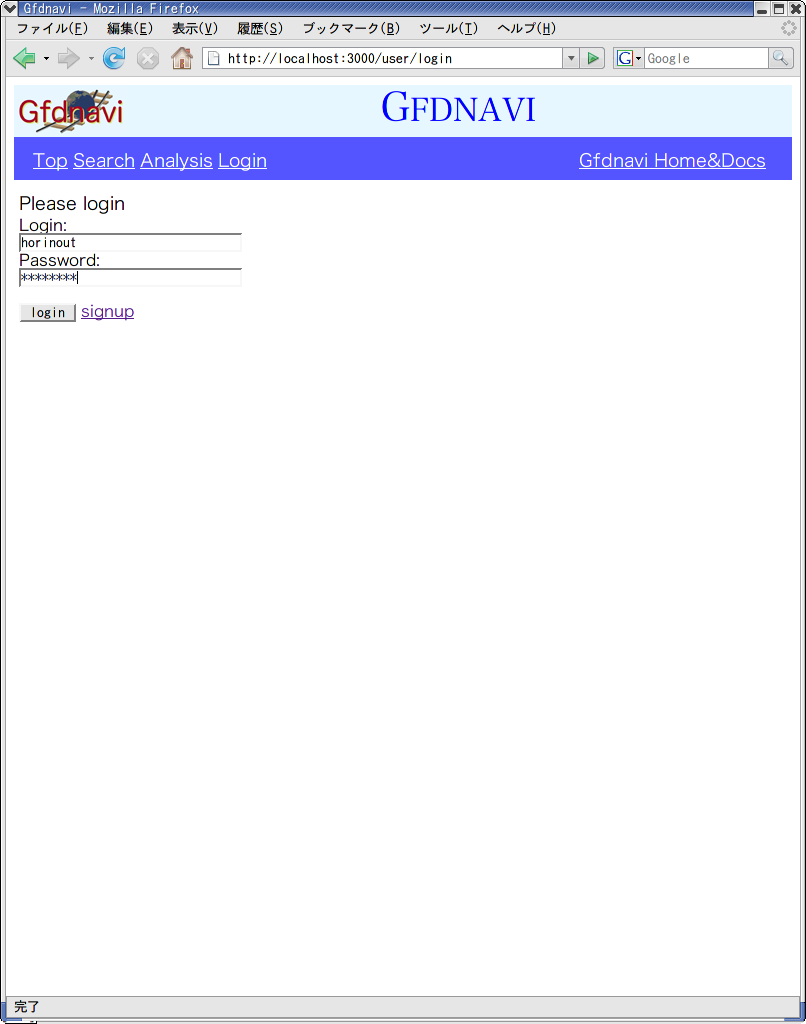
You can access Gfdnavi anonymously, but if you login,
more options are available.
To login, press the "Login" link on top.
If you don't have an account on the server, you can request
through the "sign up" button. (Whether you can actually get
an account depends on whether the administrator of the sever allows
give you one.) -->